
Malappuram's Plus One classrooms are Kerala's most crowded
 PRI Research Team· 1 Mar 2026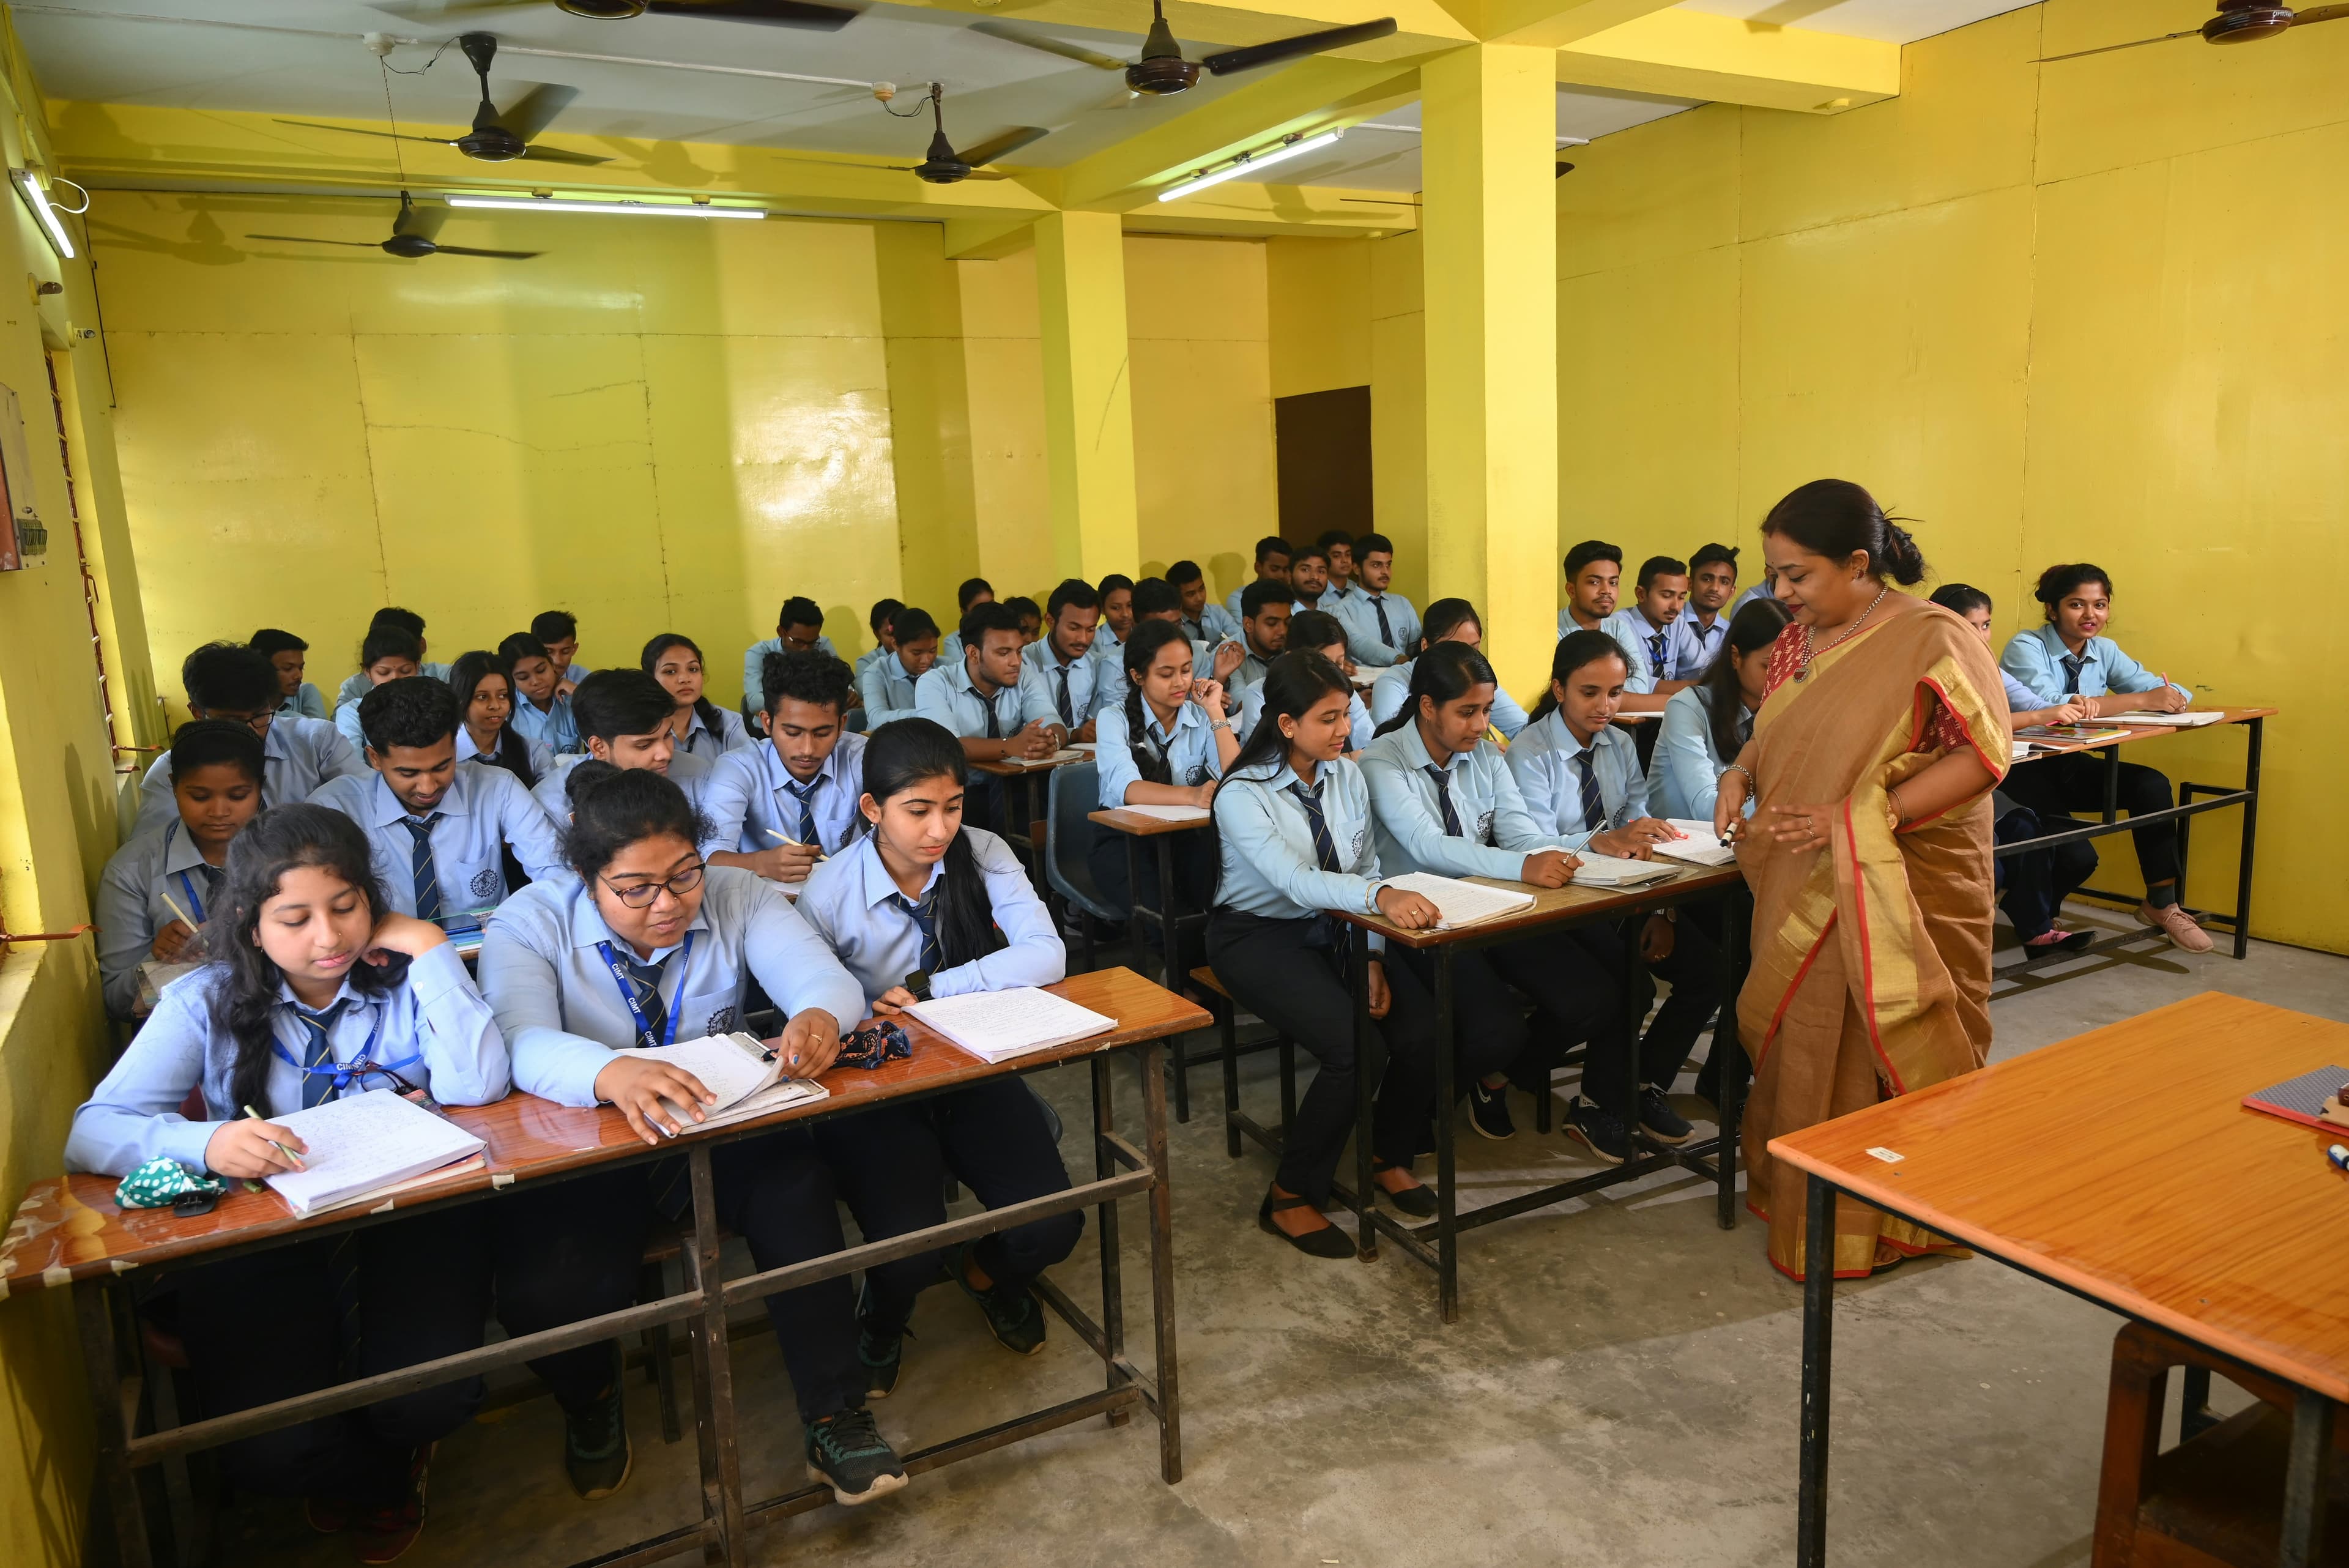
65 students a batch
That's the average Plus One batch size in Malappuram in 2025 — nearly double the 36 students per batch in Pathanamthitta, Kerala's smallest, and well above the statewide average of 54.
Kerala added 3.87 lakh Plus One seats across 7,223 batches in 2025. But that capacity isn't spread evenly, and district-level enrollment data shows the same district — Malappuram — carrying both the heaviest classroom load and the thinnest access to the science stream in the state.
The most crowded classrooms in the state
Malappuram enrolled 70,472 Plus One students across 1,080 batches in 2025 — an average of 65 students per batch, the highest of any district and 11 above the all-Kerala average of 54. Wayanad (60) and Kasargode (60) are the next most crowded. Pathanamthitta (36), Idukki (43) and Kottayam (43) run the smallest batches in the state.
Malappuram's average batch size is nearly double Pathanamthitta's, and the only district above 60 students per batch alongside Wayanad and Kasargode.
Fewer options in the science stream
Only 42% of Malappuram's Plus One batches are science batches — tied for the lowest share in Kerala with Kasargode (40%), against a statewide average of 51%. Kottayam has the most science capacity, at 63% of its batches, followed by Pathanamthitta at 58%.
Malappuram and Kasargode offer the smallest share of science batches in Kerala — roughly 9 to 11 percentage points below the state average.
Why it's happening: crowding and stream access move together
Plotting batch size against science-stream share across all 14 districts shows a clear pattern: the districts with the largest average batches — Malappuram, Wayanad, Kasargode — are also the districts with the smallest share of science batches. Districts with smaller, less-crowded batches, like Pathanamthitta and Kottayam, tend to offer proportionally more science seats. That's consistent with a simple capacity story: where the district hasn't been able to open enough batches to match demand, existing seats get stretched thinner and skew toward the lower-cost humanities and commerce streams rather than science, which needs labs and specialised staff to expand.
Each point is a district. Larger average batch size tracks with a smaller share of science batches — Malappuram sits at the crowded, science-scarce end of the line.
Where it's headed: Malappuram's seat demand, 2027–2036
Using 2012–2027 birth records for the district, the projected number of Plus One aspirants in Malappuram is expected to ease only slightly over the coming decade — from 84,265 in 2027 to 77,442 in 2036, an 8.1% decline. But the path isn't a straight line down: demand is projected to rise through the early 2030s, peaking at 86,106 in 2033, before falling toward 2036.
Malappuram's Plus One demand is projected to stay above 82,000 in eight of the ten years to 2036, easing meaningfully only in the final two years.
Peak projected demand
86,106
expected students, 2033
Lowest projected demand
77,442
expected students, 2036
Why this matters
Malappuram's Plus One pressure isn't a temporary bulge that will resolve itself in the next year or two — the source data projects demand staying near or above 82,000 students annually through 2035, only easing meaningfully by 2036. Combined with the district already running the most crowded batches and the thinnest science-stream access in the state, that points to a specific, addressable gap: more science batches, not just more batches, in the district that needs them most. Waiting for the demographic decline visible after 2034 to relieve the pressure would mean roughly another decade of Malappuram students facing the largest classes and the fewest science seats in Kerala.
Sources & notes
- Plus One seat and batch distribution by district, 2025 — batches, enrollment, share of science batches, and students per batch. Kerala Economic Review 2025 (source PDF, p.21).
- Plus One seat requirement forecast for Malappuram, 2027–2036, based on 2012–2027 yearly birth records for the district (source PDF, p.22). The source text describes the projected range as "between 84,000 and 77,000," though the year-by-year figures show a peak of 86,106 in 2033 that exceeds the stated upper bound; both the stated range and the full year-by-year series are shown here for transparency.